IC·π
Home > IC·π
What is IC·π?
IC·π is a performance discovery and improvement framework that turns operational complexity into an
auditable score you can govern and improve. It helps leadership teams stop managing by gut feel and stop
trusting green dashboards that hide red reality. With IC·π, you apply Mathematical Governance and run
improvement like a disciplined program, not a collection of disconnected projects
Governance by Math. Program Management by Math
Alignment Gap validation (a direct defense against the Watermelon Effect)
Leaders still face the “Watermelon Effect”: green dashboards on the outside, but deep red issues bleeding on
the inside. IC·π measures stakeholder alignment mathematically. If expert inputs are dangerously polarized,
IC·π flags a high-risk condition even when averages look acceptable, because a “green” score can still hide red
truth.
But IC·π does more than flag risk. It uses mathematical and statistical tools to reduce human bias in diagnostics
and decision-making, then produces a more truthful, ranked view of the Parameters and KPIs that actually drive
performance.
We do not rely on simple averages to govern performance, because averages can hide minority truth.
Discovery (SME-informed, AI-enhanced, then validated
IC·π starts by incorporating your SMEs’ expertise to define what “performance” means for your specific process.
Then our AI-hybrid approach enhances that input by surfacing hidden or under-measured drivers that may be
influencing outcomes. The result is a more complete, process-specific discovery of what matters most, before
execution begins. This prevents improvement programs from being built on assumptions, politics, or the
loudest voice in the room
Accuracy that reduces Dashboard Fatigue (focus on what moves the needle)
Most organizations do not have a data problem; they have a noise problem. ERPs, BI tools, and “gut-created”
KPIs can flood dashboards with new metrics that actually hinder decision-making. IC·π isolates the most
influential Parameters and KPIs for your process or business unit, so leaders see the signal, not the clutter. The
result is higher effectiveness (better decisions) with higher efficiency (less noise)
Dashboard Fatigue vs IC·π Focus
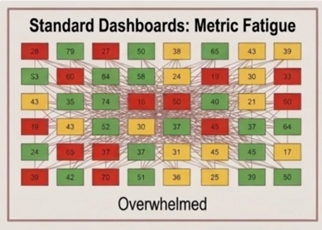
- Standard Dashboards: Metric Fatigue: A dense set of red/yellow/green tiles and connections creates
overload. The viewer sees many signals but cannot tell what matters most.
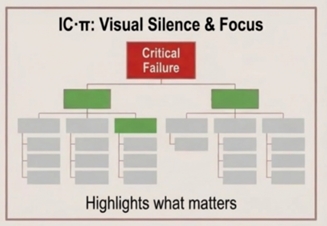
- IC·π: Visual Silence & Focus: IC·π starts from a critical outcome (Critical Failure), then collapses the
landscape into a simple structure that highlights only the branches that matter now
- What changes: The right panel is not a re-colored dashboard. It is a focus view that reduces noise and
points attention to the highest-impact path
IC·π Heat Map Rollup (Weights prevent alert fatigue
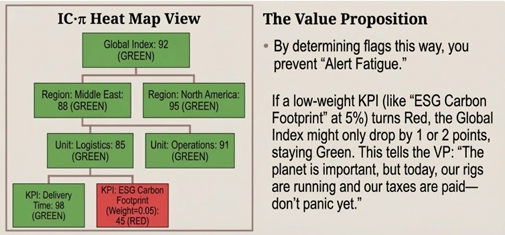
- IC·π Heat Map View: Performance rolls up from KPI to Unit to Region to Global Index. You keep a single
auditable view of performance without reviewing dozens of dashboards.
- Alert fatigue prevention: A low-weight KPI can turn Red without forcing the entire rollup to become Red.
This keeps attention on what moves the index today
Analytical quantification of performance (a performance review for the process
IC·π converts scattered KPIs into a repeatable, weighted performance index. This lets you quantify the “health”
of a process or business unit with the same discipline used to evaluate individuals, then tie improvement
actions directly to measurable outcomes.
The result is a unique, process-specific mathematical performance index formula designed for your operation’s
real circumstances. Even similar processes can require different models across organizations, regions, or
business units. IC·π is built to reflect those differences rather than forcing a generic dashboard template.
Improvement through Agile execution cycles (without moving the target
IC·π is built to change KPI outcomes continuously. After Discovery defines the performance model, you execute
short, prioritized improvement cycles to move the critical KPIs and Parameters toward the Green zone. Each
cycle delivers measurable change, and progress is evaluated against the same mathematical performance
model, so results remain auditable and comparable over time.
When circumstances truly change, Discovery can be intentionally revisited as a controlled recalibration event,
not as an ad hoc adjustment.
Backward and forward perspective with mathematical performance bands
IC·π defines Red, Yellow, and Green performance bands using mathematical tools, not arbitrary thresholds. It
looks backward to identify “rainy day” baselines and forward to simulate how KPI changes and initiatives will
shift performance over time.
IC·π is not another dashboard. It is a math-based governance engine that discovers the signal, quantifies
performance, and executes the fix.
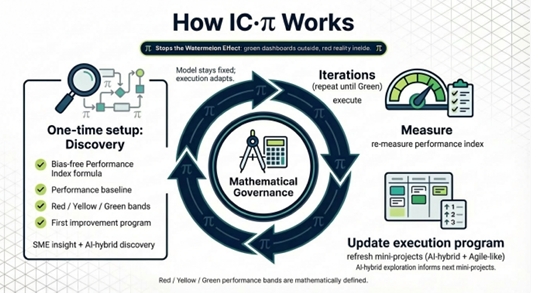
Step 1: Discovery
We establish a process-specific definition of performance by combining SME insight with AI-hybrid discovery to
surface what truly drives outcomes, including hidden or under-measured factors.
Step 2: Measure (Mathematical Governance)
We translate that discovery into a unique, process-specific performance index that turns scattered KPIs into a
clear, auditable view of where you are, and what is driving the result.
Step 3: Build the improvement program (AI-hybrid prioritization)
Using the discovery and measurement outputs, IC·π applies an AI-hybrid approach to generate the first round
of prioritized Agile execution cycles. Depending on the situation, this may be a single focused iteration or
multiple parallel iterations.
Step 4: Iterate to Green
Execute the cycles, measure again, and iterate. IC·π loops back to Step 2 after each cycle to re-evaluate
performance against the same mathematical bands, repeating until the critical KPIs and Parameters reach the
Green zone.